8-Bit Game That Makes Statistics Addictive
Before I started playing Guess the Correlation, I didn’t expect to spend an hour of my Easter weekend obsessing over an 8-bit video game, much less one based on something that many scientists do every day. I also didn’t expect to be hypnotized by graph after graph of black dots, trying to accurately gauge the patterns they concealed, in exchange for points and a place on a leaderboard. And I definitely didn’t expect to have fun doing it.
Players see a stream of scatter plots—common graphs that visualize the relationship between two things, whether temperature and ice-cream sales, or body weight and heart disease risk, or number of time spent on this infernal game and number of friends you have. Your job is to eyeball the plots and estimate a number called R, which measures how correlated the two things are. In the game, R can range from 0 (no correlation at all) to 1 (a perfect positive correlation).
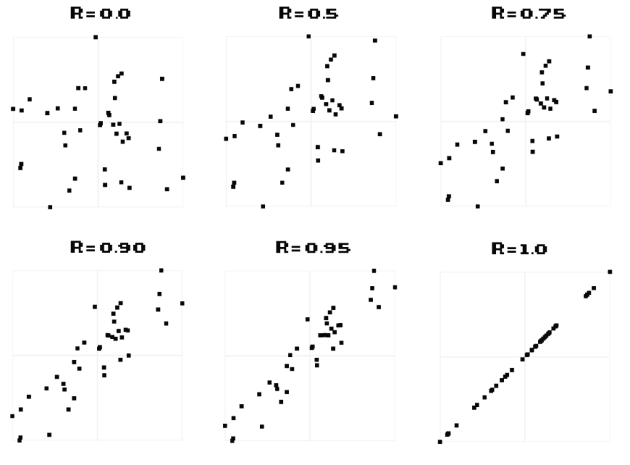
Scientists do this all the time, making judgments about correlations by looking at scatter plots. It’s deceptively hard, which I discover as I play. A strong correlation, say where R is higher than 0.8, is obvious enough because the dots line up in a clean slash. Likewise, a weak correlation, where R is lower than 0.2, looks like the target sheet of a blind shooter. But there’s a large middle ground where my estimates are often hilariously off—which is why Wagih created the game in the first place.
Last December, he attended a seminar where the speaker presented a scatter plot and baldly claimed that there was a correlation. “It looked, you know, not very correlated,” says Wagih. “I thought: Should I take his word for it? Afterwards, he showed me the R and it turned out that there was a correlation, and I had underestimated the signal. I realized I was probably not alone.”
He found several sites where you could guess the R values of randomly generated scatter plots but “they got really boring,” he says. “There’s nothing driving you to stay. That’s where I got the idea for a game.”
“Contrary to what people believe, they’re not very good at this. And I have the data to prove that.”
The mechanics are simple, enforced by minimalist design and nostalgic music. You guess the R value for a steady stream of scatter plots. You lose lives for inaccurate guesses and regain them for accurate ones. You also earn coins for good estimates, which contribute to your final score. You can even play against a friend. And that’s it.
Wagih launched the game last December and has collected a database of everyone’s estimates. He plans to analyze that data to see if there are visual elements in scatter plots that hoodwink people, causing them to overestimate or underestimate correlations. “This has been done before but the key thing here is the large amount of data that I have,” he says. Other studies involved dozens of volunteers and a few thousand estimates. As of mid-March, Wagih had 170,000 registered players and a database overflowing with four million guesses.